使用 OpenCV 和 FER 在 Python 中进行实时情感识别
情绪识别技术是心理学、人工智能和计算机科学的有趣交叉点。我们利用 OpenCV 的视频处理功能和面部情绪识别 (FER) 库来提供来自视频源的实时情绪检测。
该方法涉及捕捉面部表情,使用深度学习模型解释情绪状态,并动态地可视化这些情绪。实际应用范围从增强软件中的用户体验到为情感感知 AI 系统提供见解。
本文提供了一个实用的端到端代码实现。即插即用的解决方案,使开发人员和发烧友能够通过网络摄像头或其他视频源(如屏幕录像或视频文件)实时捕捉和分析情绪。
1. 技术栈
1.1 FER(面部情绪识别)
FER 是一个 Python 库,专注于检测面部表情中的情绪。利用预先训练的深度学习模型,FER分析图像和视频,以识别各种情绪,如愤怒、厌恶、恐惧、快乐、悲伤、惊讶和中立。
它专为易用性而设计,允许直接集成到需要情绪检测的项目中。资料来源:PyPI — FER。
1.2 OpenCV(开源计算机视觉库):
OpenCV 是计算机视觉领域的基础库。它最初由英特尔开发,广泛用于处理图像和视频。OpenCV 支持包括 Python 在内的多种编程语言,并以其在实时应用程序中的高效率而闻名。
该库在图像和视频处理中起着至关重要的作用,非常适合捕获网络摄像头源、视频处理和在图像上绘制注释等任务。资料来源:OpenCV 文档。
1.4 MediaPipe(此处未使用)
在我们讨论实时情感识别技术栈的背景下,还值得一提的是 MediaPipe,尽管它没有用于此特定实现,但我们认为读者会从知识中受益。
MediaPipe 是 Google 开发的一个框架,用于构建多模态(音频、视频、时间序列等)应用机器学习管道。它为直播和流媒体提供可定制的 ML 解决方案,并以其面部识别、手部跟踪和姿势估计功能而闻名。
MediaPipe是一个强大的工具,有兴趣进一步探索实时图像和视频处理的读者可能会发现它很有价值。
在面部情绪检测之外,还需要更复杂或更多样化的视觉数据处理和识别任务的场景中,它尤其有效。资料来源:MediaPipe Github。
2. Python 实现
实现很简单,主要需要四个库:FER、OpenCV、matplotlib 和 imageio。
要设置运行情绪识别代码的环境,我们需要安装必要的库。通过命令提示符或终端,然后运行以下命令:
pip install fer
pip install opencv-python
pip install matplotlib
pip install imageio
2.1 实时情绪检测
我们介绍了使用 Python 进行实时情绪检测的基本概念。为了保持简单易用,我们从演示核心功能的基本脚本开始。
这个初始示例将侧重于从网络摄像头捕获视频并使用 FER 库实时检测情绪。
虽然我们的示例使用实时网络摄像头源,但您可以轻松地调整脚本以使用其他源。例如,您可以将网络摄像头源替换为视频文件甚至实时屏幕录制。
- **启动网络摄像头源:**首先,我们使用 OpenCV 从网络摄像头捕获视频。OpenCV 的函数初始化网络摄像头源。在大多数情况下,传递到会选择默认网络摄像头。VideoCapture0VideoCapture
- **检测情绪:**接下来,我们利用 FER 库,它提供了一个简单的界面来检测视频帧中的情绪。当从网络摄像头捕获帧时,FER 会处理该帧以检测面部及其相应的情绪。
- **突出显示检测到的情绪:**一旦检测到情绪,我们就会使用 OpenCV 函数在视频帧中检测到的人脸上绘制边界框和文本注释。文本标签指示检测到的情绪及其置信度。
from fer import FER
import cv2

# Initialize the detector
detector = FER(mtcnn=True)

# Start webcam
cap = cv2.VideoCapture(0)

try:
    while True:
        ret, frame = cap.read()
        if not ret:
            break

        # Detect emotions on the frame
        result = detector.detect_emotions(frame)
        for face in result:
            # Unpack the values
            box = face["box"]
            emotions = face["emotions"]

            x, y, w, h = box
            cv2.rectangle(frame, (x, y), (x+w, y+h), (0, 255, 0), 2)

            # Find the emotion with the highest score
            emotion_type = max(emotions, key=emotions.get)
            emotion_score = emotions[emotion_type]

            # Display the emotion type and its confidence level
            emotion_text = f"{emotion_type}: {emotion_score:.2f}"
            cv2.putText(frame, emotion_text, (x, y - 10), cv2.FONT_HERSHEY_SIMPLEX, 0.9, (0, 255, 0), 2)

        # Display the resulting frame
        cv2.imshow('Emotion Detection', frame)

        # Break the loop
        if cv2.waitKey(1) & 0xFF == ord('q'):
            break
except KeyboardInterrupt:
    print("Interrupted by user")
finally:
    # When everything is done, release the capture
    cap.release()
    cv2.destroyAllWindows()
2.2 实时情感可视化
在基本的实时情绪检测脚本的基础上,我们扩展了功能,包括实时情绪可视化。
此增强功能为我们的情绪检测应用程序增加了更具动态性和交互性的方面,使数据更具吸引力和洞察力。
**创建实时情感条形图:**为了可视化在每一帧中检测到的情绪,我们使用了 matplotlib,这是一个强大的 Python 绘图库。以下是我们的设置方法:
- 我们初始化一个 matplotlib 图形,并创建一个带有每种情绪占位符的条形图。
- 图表中的每个条形代表一种情绪,其高度将实时更新以反映 FER 检测到的置信水平。
import matplotlib.pyplot as plt

plt.ion()  # Turn on interactive mode
fig, ax = plt.subplots()
emotion_labels = ['angry', 'disgust', 'fear', 'happy', 'sad', 'surprise', 'neutral']
bars = ax.bar(emotion_labels, [0]*7, color='lightblue')
**Matplotlib 中的交互模式:**通过启用交互模式 (),matplotlib 的绘图会实时更新。这允许条形图随着情绪检测算法处理的每个新帧而动态刷新。plt.ion()
**更新图表:**我们创建了一个函数,该函数接收检测到的情绪并相应地更新每个柱的高度。对处理的每个帧调用此函数,确保图表准确反映检测到的当前情绪。update_chart
def update_chart(detected_emotions, bars, ax, fig):
    ax.clear()
    ax.bar(emotion_labels, [detected_emotions.get(emotion, 0) for emotion in emotion_labels], color='lightblue')
    ### [Rest of Chart Formatting]
    fig.canvas.flush_events()
**在主循环中集成图表更新:**在脚本的主循环中,在检测到每一帧的情绪后,我们使用最新的情绪数据进行调用。这样可以使可视化效果与视频源保持同步。update_chart
# Main loop for emotion detection and visualization
while True:
    # [Webcam capture and emotion detection code]

    if largest_face:
        # [Face processing and emotion scoring]

        # Update the live bar chart with the latest emotion data
        update_chart(current_emotions, bars, ax, fig)
综上所述,我们得到了以下全面的 Python 脚本。
from fer import FER
import cv2
import matplotlib.pyplot as plt
import numpy as np
import pandas as pd
import imageio
import matplotlib
import time

"""
Real-Time Emotion Detection and Visualization

This script captures video from a webcam, detects emotions on faces in real-time,
and visualizes the results both in a live bar chart and in the video itself. It also
saves the video feed with detected emotions, the live bar chart as a GIF, and
cumulative emotion statistics over time as a static chart. The script uses OpenCV for
video processing, FER for emotion detection, matplotlib for live chart visualization,
and imageio for GIF creation.

Key Features:
- Real-time emotion detection from webcam feed.
- Live update of emotion confidence levels in a bar chart.
- Saving the video feed with bounding boxes around faces and emotion labels.
- Generating a GIF of the live emotion bar chart.
- Saving a cumulative chart of emotion statistics over time.
"""


# Set the backend for matplotlib to 'TkAgg' for compatibility with different environments
matplotlib.use('TkAgg')

# Initialize the FER (Face Emotion Recognition) detector using MTCNN
detector = FER(mtcnn=True)

# Start capturing video from the webcam (device 0)
cap = cv2.VideoCapture(0)

# Set a frame rate for recording the video (adjust based on your webcam's capabilities)
frame_rate = 4.3

# Initialize OpenCV's VideoWriter to save the video with the specified frame rate
fourcc = cv2.VideoWriter_fourcc(*'XVID')
out = cv2.VideoWriter('emotion_video.avi', fourcc, frame_rate, (640, 480))

# Set up a matplotlib figure for displaying live emotion detection results
plt.ion()  # Turn on interactive mode for live updates
fig, ax = plt.subplots()
emotion_labels = ['angry', 'disgust', 'fear', 'happy', 'sad', 'surprise', 'neutral']
bars = ax.bar(emotion_labels, [0]*7, color='lightblue') # Initialize bars for each emotion
plt.ylim(0, 1)
plt.ylabel('Confidence')
plt.title('Real-time Emotion Detection')
ax.set_xticklabels(emotion_labels, rotation=45)

# Initialize imageio writer to save live chart updates as a GIF
gif_writer = imageio.get_writer('emotion_chart.gif', mode='I', duration=0.1)

# List to store cumulative emotion statistics for each frame
emotion_statistics = []

# Function to update the live chart
def update_chart(detected_emotions, bars, ax, fig):
    # Clear the current axes and set up the bar chart again
    ax.clear()
    ax.bar(emotion_labels, [detected_emotions.get(emotion, 0) for emotion in emotion_labels], color='lightblue')
    plt.ylim(0, 1)
    plt.ylabel('Confidence')
    plt.title('Real-time Emotion Detection')
    ax.set_xticklabels(emotion_labels, rotation=45)
    fig.canvas.draw()
    fig.canvas.flush_events()

# Start the timer to measure the active time of the webcam
webcam_start_time = time.time()

try:
    while True:
        ret, frame = cap.read() # Read a frame from the webcam
        if not ret:
            break # Break the loop if no frame is captured

        # Detect emotions on the frame
        result = detector.detect_emotions(frame)
        largest_face = None
        max_area = 0

        # Find the largest face in the frame for primary emotion analysis
        for face in result:
            box = face["box"]
            x, y, w, h = box
            area = w * h
            if area > max_area:
                max_area = area
                largest_face = face

        # If a face is detected, display the emotion and update the chart
        if largest_face:
            box = largest_face["box"]
            current_emotions = largest_face["emotions"]

            # Store the emotion data
            emotion_statistics.append(current_emotions)

            x, y, w, h = box
            cv2.rectangle(frame, (x, y), (x+w, y+h), (0, 255, 0), 2)

            emotion_type = max(current_emotions, key=current_emotions.get)
            emotion_score = current_emotions[emotion_type]

            emotion_text = f"{emotion_type}: {emotion_score:.2f}"
            cv2.putText(frame, emotion_text, (x, y - 10), cv2.FONT_HERSHEY_SIMPLEX, 0.9, (0, 255, 0), 2)

            update_chart(current_emotions, bars, ax, fig)

            out.write(frame) # Write the frame to the video file

            # Save the current state of the bar chart as a frame in the GIF
            fig.canvas.draw()
            image = np.frombuffer(fig.canvas.tostring_rgb(), dtype='uint8')
            image = image.reshape(fig.canvas.get_width_height()[::-1] + (3,))
            gif_writer.append_data(image)

        cv2.imshow('Emotion Detection', frame) # Display the frame

        if cv2.waitKey(1) & 0xFF == ord('q'):
            break

except KeyboardInterrupt:
    print("Interrupted by user")

finally:
    webcam_end_time = time.time()  # End timer when webcam window closes
    print(f"Webcam active time: {webcam_end_time - webcam_start_time:.2f} seconds")

    cap.release()
    cv2.destroyAllWindows()
    plt.close(fig)

    out.release()
    gif_writer.close()

    emotion_df = pd.DataFrame(emotion_statistics)

    plt.figure(figsize=(10, 10))
    for emotion in emotion_labels:
        plt.plot(emotion_df[emotion].cumsum(), label=emotion)
    plt.title('Cumulative Emotion Statistics Over Time')
    plt.xlabel('Frame')
    plt.ylabel('Cumulative Confidence')
    plt.legend()
    plt.savefig('cumulative_emotions.jpg')
    plt.close()

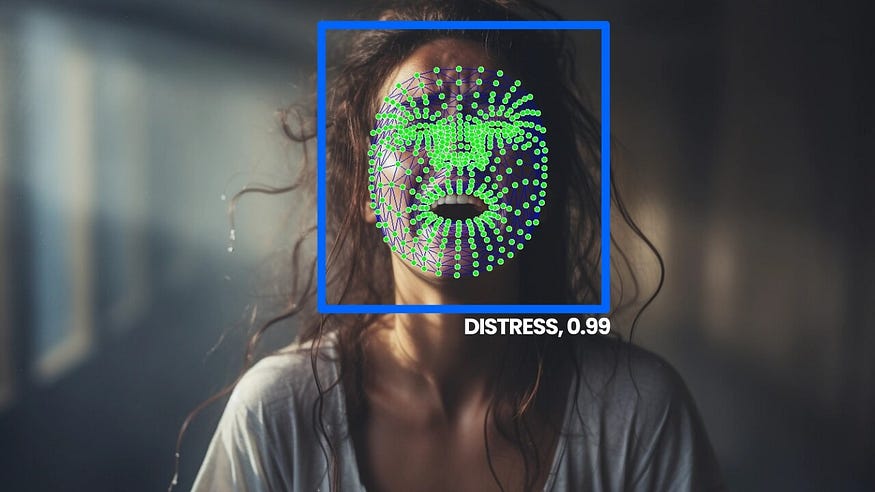
图1: 实时情绪检测显示在左侧,其中情绪在主体的脸上突出显示。中间的图表动态显示各种情绪的置信度,而右边的图表则跟踪一段时间内累积的情绪反应。
2.3 — 组合输出
当我们能够以全面和引人入胜的方式可视化数据时,情绪检测技术的真正力量就会大放异彩。为了实现这一点,我们开发了一个脚本,将各种输出组合到一个视觉演示中。此脚本有效地对齐了三个元素:
- **实时视频:**从网络摄像头源中捕获的情绪检测,保存为“emotion_video.avi”。
- **动态条形图 GIF:**检测到的情绪的实时更新表示,存储在“emotion_chart.gif”中。
- **静态累积情绪图表:**图像文件“cumulative_emotions.jpg”,显示一段时间内汇总的情绪数据。
脚本中的关键片段:
- 读取和处理输入:
static_chart = Image.open('cumulative_emotions.jpg')
video = cv2.VideoCapture('emotion_video.avi')
bar_chart_gif = imageio.mimread('emotion_chart.gif')
- 组合帧逻辑:
combined_frame = Image.new('RGB', (3 * desired_width, desired_height))
combined_frame.paste(video_frame_resized, (0, 0))
combined_frame.paste(gif_resized, (desired_width, 0))
combined_frame.paste(static_chart_resized, (2 * desired_width, 0))
对于那些有兴趣探索完整代码并进一步深入研究技术细节的人,我鼓励您访问我们的网站 Entreprenerdly.com,该资源包括一系列有关 AI、数据科学和技术的技术教程和实用指南。
5. 实际应用
- **安全系统:**情绪识别可以为安全系统增加一层,有可能根据情绪线索识别可疑或异常行为。
- **医疗保健和心理健康:**在临床环境中,情绪识别可以帮助监测患者的心理健康状态。它在远程治疗中特别有用,为治疗师提供了对患者情绪反应的额外见解。
- **用户体验和界面设计:**网站和应用程序可以使用情感识别来定制用户体验。例如,检测困惑或不满的迹象可以触发有用的提示或引导用户访问更相关的内容。
- **机器人和人工智能:**在机器人技术中,情感识别可以使与人工智能和机器人的交互更加自然和直观,尤其是在护理或客户服务机器人中。
- **无障碍技术:**对于有言语或听力障碍的人,情绪识别技术可以通过提供有关说话者情绪状态的额外背景来促进沟通。
6. 限制和改进
6.1 限制
- **准确性和对数据的依赖性:**情绪检测的准确性很大程度上取决于FER模型的训练数据。这些数据中的偏差可能导致不正确或不一致的情绪识别,尤其是在不同的人口统计数据中。
- **情境理解:**该系统缺乏理解情绪背景的能力。它能识别面部表情,但无法推断这些表情背后的原因,也无法区分真实和模拟的情绪。
- 照明和饲料质量: 网络摄像头馈送的质量(包括照明条件和分辨率)会显着影响检测精度。视频质量差可能会导致情绪识别不可靠。
- **隐私问题:**使用情绪识别,尤其是在公共或半公共场所,会引发隐私问题。在实施此类系统时,同意和道德考虑至关重要。
6.2 需要改进的领域:
- **增强的机器学习模型:**集成更高级的机器学习模型或自定义现有的 FER 模型可以提高准确性并减少偏差。
- **上下文感知算法:**开发考虑情况背景的算法可以提供更细致入微的情绪分析。
- **实时处理优化:**优化代码以提高效率或使用更强大的处理硬件可以最大限度地减少实时应用程序的延迟。
- **解决隐私问题:**实施严格的隐私协议并确保数据使用方式的透明度可以减轻隐私问题。
我们已经看到了如何将这些强大的工具结合起来,不仅可以实时检测情绪,还可以以引人入胜和信息丰富的方式可视化这些数据。这项技术的实际应用是广泛而多样的,从医疗保健到营销,提供了与我们的情感反应互动和理解的新方法。